如何快速實現REST API集成以優化業務流程
雖然?audio?標簽使用起來很簡單,但也存在一些局限。比如它只控制音頻的播放、暫停、音量等。如果我們想進一步控制音頻,比如通道合并和拆分、混響、音高和音頻幅度壓縮等。那么僅僅使用?audio?標簽是做不到的。為了解決這個問題,我們需要使用?Web Audio API。
Web Audio API 提供了一個非常高效和通用的系統來控制 Web 上的音頻,允許開發人員為音頻添加特殊效果、可視化音頻、添加空間效果等等。Web Audio API 讓用戶能夠在音頻上下文(AudioContext)中進行音頻操作,具有模塊化路由的特點。基本的音頻操作是在音頻節點上執行的,這些節點連接在一起形成一個音頻路由圖。
接下來,我將演示如何利用?AudioContext?對象來播放音頻:
<!DOCTYPE html>

<html lang="en">

<head>

    <meta charset="UTF-8">

    <meta http-equiv="X-UA-Compatible" content="IE=edge">

    <meta name="viewport" content="width=device-width, initial-scale=1.0">

    <title>Audio Context</title>

</head>

<body>

    <input id="audioFile" type="file" accept="audio/*"/>

    <script>

    const inputFile = document.querySelector("#audioFile");

    inputFile.onchange = function(event) {

      const file = event.target.files[0];

      const reader = new FileReader();

      reader.readAsArrayBuffer(file);

      reader.onload = evt => {

          const encodedBuffer = evt.currentTarget.result;

          const context = new AudioContext();

          context.decodeAudioData(encodedBuffer, decodedBuffer => {

              const dataSource = context.createBufferSource();

              dataSource.buffer = decodedBuffer;

              dataSource.connect(context.destination);

              dataSource.start();

          })

      }

    }

    </script>

</body>

</html>
在以上代碼中,我們使用 FileReader API 來讀取音頻文件的數據。然后創建一個 AudioContext 對象并使用該對象上的 decodeAudioData 方法解碼音頻。獲取到解碼后的數據后,我們會繼續創建一個 AudioBufferSourceNode 對象來存儲解碼后的音頻數據,然后將 AudioBufferSourceNode 對象與 context.destination 對象連接起來,最后調用 start 方法播放音頻。
看到這里,是不是覺得使用 AudioContext 播放音頻文件很麻煩?實際上它非常強大。下面我將介紹如何使用 AudioContext、AnalyserNode、Canvas 來實現音頻可視化的功能。
可視化音頻文件主要分為以下 3 個步驟:
在以下的代碼中,我們使用?FileReader?API 來讀取音頻文件的數據。然后創建一個?AudioContext?對象并使用該對象上的?decodeAudioData?方法解碼音頻。當然,你也可以從網絡上下載音頻文件。
inputFile.onchange = function(event) {

  const file = event.target.files[0];

  const reader = new FileReader();

  reader.readAsArrayBuffer(file);

  reader.onload = evt=>{

    const encodedBuffer = evt.currentTarget.result;

    const context = new AudioContext();

    context.decodeAudioData(encodedBuffer, decodedBuffer=>{

      const dataSource = context.createBufferSource();

      dataSource.buffer = decodedBuffer;

      analyser = createAnalyser(context, dataSource);

      bufferLength = analyser.frequencyBinCount;

      frequencyData = new Uint8Array(bufferLength);

      dataSource.start();

      drawBar();

    }

 )

}要獲取頻率數據,我們需要利用?AnalyserNode?接口,該接口提供實時頻率和時域分析信息。
const analyser = audioCtx.createAnalyser();

analyser.fftSize = 512;

const bufferLength = analyser.frequencyBinCount;

const dataArray = new Uint8Array(bufferLength);

analyser.getByteFrequencyData(dataArray);
AnalyserNode 對象上的?getByteFrequencyData()?方法會將當前頻率數據復制到傳入的?Uint8Array?對象。
獲取頻率數據后,我們就可以使用 Canvas API 實現數據可視化,比如使用 CanvasRenderingContext2D 接口中的?fillRect?方法,對數據進行可視化。
function drawBar() {

  requestAnimationFrame(drawBar);

  analyser.getByteFrequencyData(frequencyData);

  canvasContext.clearRect(0, 0, canvasWidth, canvasHeight);

  let barHeight, barWidth, r, g, b;

  for (let i = 0, x = 0; i < bufferLength; i++) {

    barHeight = frequencyData[i];

    barWidth = canvasWidth / bufferLength * 2;

    r = barHeight + 25 * (i / bufferLength);

    g = 250 * (i / bufferLength);

    b = 50;

    canvasContext.fillStyle = "rgb(" + r + "," + g + "," + b + ")";

    canvasContext.fillRect(x, canvasHeight - barHeight, barWidth, barHeight);

    x += barWidth + 2;

  }

}
分析完上面的處理流程,我們來看一下完整的代碼:
<!DOCTYPE html>

<html lang="en">

    <head>

        <meta charset="UTF-8">

        <meta http-equiv="X-UA-Compatible" content="IE=edge">

        <meta name="viewport" content="width=device-width, initial-scale=1.0">

        <title>Visualizations with Web Audio API</title>

    </head>

    <body>

        <input id="audioFile" type="file" accept="audio/*"/>

        <canvas id="canvas"></canvas>

        <script>

            const canvas = document.querySelector("#canvas");

            const inputFile = document.querySelector("#audioFile");


            const canvasWidth = window.innerWidth;

            const canvasHeight = window.innerHeight;

            const canvasContext = canvas.getContext("2d");

            canvas.width = canvasWidth;

            canvas.height = canvasHeight;

            let frequencyData = [], bufferLength = 0, analyser;


            inputFile.onchange = function(event) {

                const file = event.target.files[0];


                const reader = new FileReader();

                reader.readAsArrayBuffer(file);

                reader.onload = evt=>{

                    const encodedBuffer = evt.currentTarget.result;

                    const context = new AudioContext();

                    context.decodeAudioData(encodedBuffer, decodedBuffer=>{

                        const dataSource = context.createBufferSource();

                        dataSource.buffer = decodedBuffer;

                        analyser = createAnalyser(context, dataSource);

                        bufferLength = analyser.frequencyBinCount;

                        frequencyData = new Uint8Array(bufferLength);

                        dataSource.start();

                        drawBar();

                    }

                    )

                }


                function createAnalyser(context, dataSource) {

                    const analyser = context.createAnalyser();

                    analyser.fftSize = 512;

                    dataSource.connect(analyser);

                    analyser.connect(context.destination);

                    return analyser;

                }


                function drawBar() {

                    requestAnimationFrame(drawBar);

                    analyser.getByteFrequencyData(frequencyData);

                    canvasContext.clearRect(0, 0, canvasWidth, canvasHeight);

                    let barHeight, barWidth, r, g, b;

                    for (let i = 0, x = 0; i < bufferLength; i++) {

                        barHeight = frequencyData[i];

                        barWidth = canvasWidth / bufferLength * 2;

                        r = barHeight + 25 * (i / bufferLength);

                        g = 250 * (i / bufferLength);

                        b = 50;

                        canvasContext.fillStyle = "rgb(" + r + "," + g + "," + b + ")";

                        canvasContext.fillRect(x, canvasHeight - barHeight, barWidth, barHeight);

                        x += barWidth + 2;

                    }

                }

            }

        </script>

    </body>

</html>
瀏覽器打開包含上述代碼的網頁,然后選擇一個音頻文件后,你就可以看到類似的圖形。
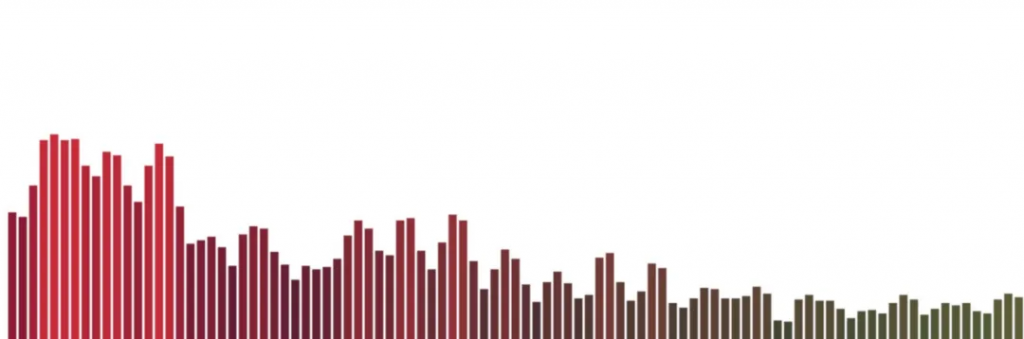
事實上,我們有了頻率數據之后,我們還可以使用 Canvas API 繪制其他漂亮的圖形。


以上圖形是使用 Github 上的第三方庫?vudio.js?生成的。如果你有其它很酷的音頻可視化效果,歡迎給我留言哈。
文章轉自微信公眾號@全棧修仙之路